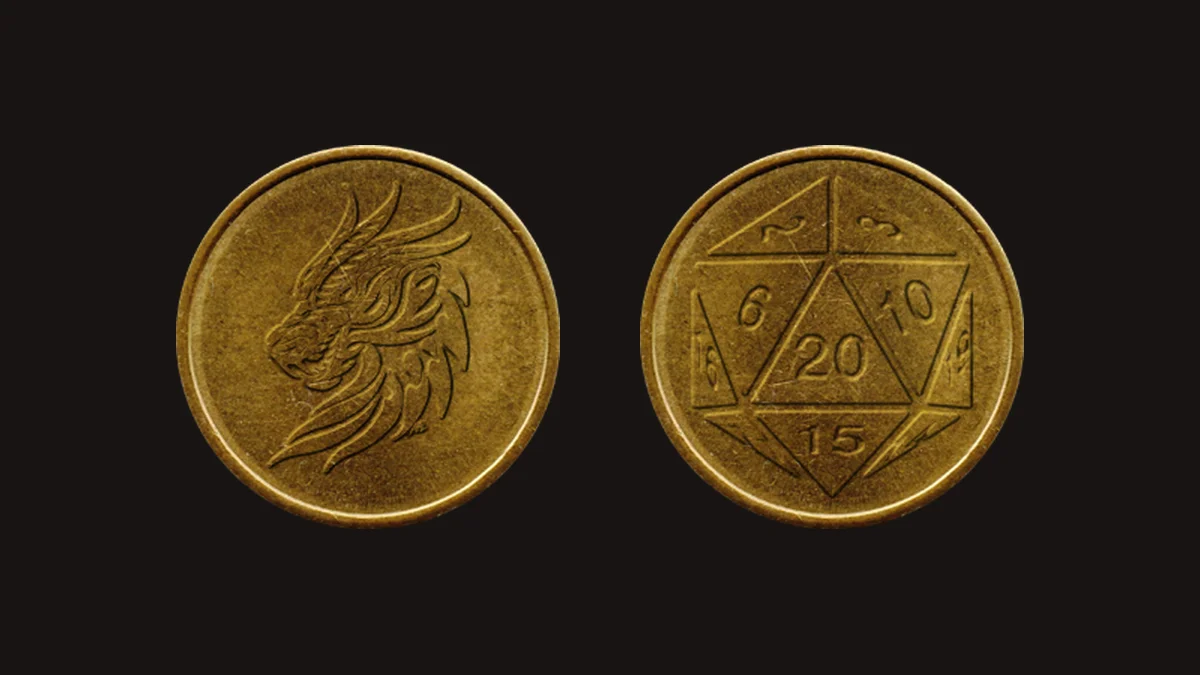
A coin has two sides and one job: be fair. It is not quite fair. A person flipping a coin by thumb lands it on the side it started on about 51% of the time [1][2].
That one percent is where this post lives. Chance is the maths of what the dice do. Luck is the story we tell about it afterwards. Coincidence is what happens when enough dice meet enough people. Tia brings the psychology; Rohan brings the spreadsheet and the objections.
The coin is 51/49, and it's your thumb's fault
In 2007 the statistician Persi Diaconis, with Susan Holmes and Richard Montgomery, filmed coin tosses with a high-speed camera. A thumb-flipped coin does not only spin end over end; it wobbles, and a wobbling coin spends a little more of its flight with the starting face up. Their model put the chance of a coin "coming up as started" at "about .51" [1].
Sixteen years later František Bartoš and 49 co-authors tested it the hard way: 48 people, coins from dozens of currencies, 350,757 flips. The result, published in the Journal of the American Statistical Association: same side as started 50.8% of the time, 95% interval 50.6% to 50.9%. Heads against tails: 50.0%, no bias at all [2]. Some flippers barely showed the effect; others showed far more of it [2].
What that gives you:
- Heads versus tails is fair. The bias is toward the starting face, not either face.
- Don't let the caller see the coin before the flip. If they know which side is up, they win about 51 times in 100.
- A catch is not a spin. The effect is for coins flipped by thumb and caught [1]. Spinning a coin on the table is a different machine.
Rohan's view: over a campaign's worth of "who takes first watch", 0.8% is nothing. Over a bet with real stakes, flip it yourself or roll the d2 on the main roller, which draws from your browser's cryptographic random number generator and has no thumb.
When to flip and when to roll
The rules say when dice belong: "When the outcome is uncertain and narratively interesting, the dice determine the result" (SRD 5.2.1, "Playing the Game", Ability Checks) [3]. A coin is the smallest version of that promise: two outcomes, equal weight, no modifier.
Flip (or roll a d2) when:
- Two outcomes are genuinely equal and nobody's skill should matter: which door the goblin chose, whether the storm breaks tonight.
- The table is stuck on a choice that doesn't matter and needs permission to move.
Roll a d20 when skill, preparation or circumstance should tilt the result. A coin can't take a modifier. A d20 can.
Here is the closest thing D&D has to a coin flip, and the most stressful: the Death Saving Throw. Roll 1d20; 10 or higher succeeds, so each roll is 55/45. Three successes and you are Stable; three failures and you die. A 1 counts as two failures. A 20 brings you back with 1 Hit Point [3].
We computed it exactly (every path, no help from the party, no further damage):
| Outcome from 0 Hit Points | Chance |
|---|---|
| You live (Stable, or up on a natural 20) | 59.5% |
| of which: back on your feet with a natural 20 | 18.1% |
| You die | 40.5% |
Four in ten. Tia's note: the fear at the table is not overreaction. Someone should spend an action on you.
Streaks: fair dice come in clumps
Ask people to write down 20 "random" coin flips and they alternate too much. Tversky and Kahneman described it in 1974: people expect even a short run of chance to look like the long run. After a long run of red on a roulette wheel, most people believe black is now "due" [4]. That is the gambler's fallacy. The wheel has no memory. Neither does your d20.
Real randomness is streakier than it looks. Computed exactly for 20 fair flips:
| In 20 flips, a run of at least… | Heads only | Heads or tails |
|---|---|---|
| 4 in a row | 47.8% | 76.8% |
| 5 in a row | 25.0% | 45.8% |
| 6 in a row | 12.2% | 23.7% |
| 7 in a row | 5.8% | 11.5% |
Nearly half of all 20-flip sequences contain a run of five. If a player's "random" list never has one, it was written by a person.
The hot hand, reversed
The opposite belief is the hot hand: the shooter who has made three in a row is more likely to make the fourth. In 1985 Gilovich, Vallone and Tversky surveyed basketball fans (91% agreed a player has "a better chance of making a shot after having just made his last two or three shots") and then checked the shooting records. They found no streakiness beyond chance, and the hot hand became psychology's favourite example of seeing patterns in noise [5].
Then in 2018 Joshua Miller and Adam Sanjurjo found a flaw in the measuring stick. Flip a fair coin four times and look at what follows each heads. Averaged over all possible sequences, the share of heads-after-heads is not 50%. It is 40.5% (we checked every sequence by script). Looking at a streak and then at the next shot builds in a bias against streaks. Corrected for it, the original data reverse: the shooters did get hot [6].
Rohan, who has been waiting all post for this: people get hot. Dice don't. A shooter has confidence, fatigue, rhythm. A d20 has 20 faces and no feelings. The hot hand can be real for your players' tactics and still be a myth for their dice.
Luck: the illusion of control
Luck is where Tia takes over, because it is psychology, not physics.
In 1975 Ellen Langer gave office workers lottery tickets. Some chose their own ticket; the rest were handed one. Offered a chance to sell it back, the choosers asked, on average, $8.67. The people handed a ticket asked $1.96 [7]. Same odds. More than four times the price, because choosing felt like skill.
Langer called it the illusion of control: "an expectancy of a personal success probability inappropriately higher than the objective probability would warrant" [7]. In the same paper she cites the sociologist James Henslin, who spent time with dice players and watched them throw softly for low numbers and hard for high ones [7][8].
Every table has a Henslin player. The one who warms the d20 in their palm, retires a die to the "jail", or insists on rolling their own dice in 3D because the physics feels more honest.
Tia's position: leave the rituals alone. The illusion of control is harmless at a game table and it keeps people invested. It turns harmful in one place: when a player decides a die is cursed and the blame lands on a person, the DM or the friend who lent it. That calls for arithmetic, not a pep talk.
Coincidence: the law of truly large numbers
In 1989 Persi Diaconis (the coin man again) and Frederick Mosteller wrote the paper on coincidences. Their principle: "With a large enough sample, any outrageous thing is likely to happen." A one-in-a-million event, in a country of 250 million people, happens about 250 times a day [9].
Your table is a smaller country, but it rolls a lot. Assume one player makes 50 d20 rolls in a session (attacks, checks, saves; adjust for your table):
| d20 rolls in a session | At least one natural 1 | Two 1s in a row somewhere | Three 1s in a row somewhere |
|---|---|---|---|
| 20 | 64.2% | 4.5% | 0.21% |
| 50 | 92.3% | 11.1% | 0.57% |
| 100 | 99.4% | 21.1% | 1.16% |
| 150 | 99.95% | 30.0% | 1.74% |
Back-to-back natural 1s show up in about one session in nine for a 50-roll player. At a table of five, all rolling, somebody sees it most weeks. If five players each make 30 rolls, the chance that at least one of them sees four or more 1s is 26.9%: about one session in four, with perfectly fair dice.
The coincidence isn't that it happened. It's that it happened to you, and you were the one watching.
How to test a die you think is cursed
Before you throw a d20 in the lake, test it. Karl Pearson built the tool for this in 1900: the chi-square goodness-of-fit test [10]. It asks one question: are these counts further from even than chance would usually push them?
Step 1. Roll a lot. You need at least 5 expected hits per face, so a d20 needs 100 rolls minimum. Do 200: then every face expects 10.
Step 2. Tally. Here is a worked tally of 200 rolls where the 1 came up 17 times, the result that starts arguments:
| Face | 1 | 2 | 3 | 4 | 5 | 6 | 7 | 8 | 9 | 10 |
|---|---|---|---|---|---|---|---|---|---|---|
| Count | 17 | 8 | 11 | 9 | 12 | 7 | 10 | 13 | 9 | 8 |
| Face | 11 | 12 | 13 | 14 | 15 | 16 | 17 | 18 | 19 | 20 |
| Count | 11 | 10 | 6 | 12 | 9 | 11 | 8 | 10 | 9 | 10 |
Step 3. Score each face. For each face: (count − 10)² ÷ 10. The 1: (17 − 10)² ÷ 10 = 4.9. The 13: (6 − 10)² ÷ 10 = 1.6. A face at 10 scores 0.
Step 4. Add them up. This tally totals 11.0.
Step 5. Compare. A d20 has 19 degrees of freedom (faces minus one). At the usual 5% line, the critical value is 30.14. Under 30.14, the die passes. At 11.0, the p-value is about 0.92: a fair die produces counts at least this lumpy 92% of the time.
The die is fine. Why did 17 ones look so damning? For the 1 alone, 17 or more in 200 rolls is a 2.4% event. But you didn't pick the 1 before rolling; you noticed it after. In a simulation of 20,000 fair 200-roll tallies, some face reached 17 or more 41% of the time. Pick the face you suspect before you roll, or test all of them at once with chi-square. Otherwise you find the outrageous thing Diaconis and Mosteller promised you'd find [9].
Rohan's rule: if a die fails at 200 rolls, roll it 200 more. Test it twice before you convict it.
The short of it
- A caught coin favours its starting face, 50.8 to 49.2. Heads and tails are even [2].
- Streaks are normal. Five in a row turns up in nearly half of all 20-flip runs.
- People can get hot [6]. Dice can't.
- Choosing feels like control, and control feels like better odds [7]. It isn't.
- A cursed die is a claim. Test it with 200 rolls and chi-square before you blame the die, or the person who lent it.
Roll a d2 on the main roller, or take the whole set to the 3D table and start your tally.
How we got the numbers: exact calculation by script for the streak, natural 1, death save, heads-after-heads and chi-square figures; "some face reaches 17 in 200 rolls" is a 20,000-trial simulation. All assume fair dice and independent rolls.
Table Talk
Tia: A coin lands on the side it started on 51% of the time. Your thumb has an opinion.
Rohan: Point eight percent. For who takes first watch, it's nothing.
Tia: Then why did you make me flip it with my eyes closed last week?
Rohan: Because you were calling it. Different problem.
Tia: And the lottery study: choose your own ticket and you want over four times the money to sell it. Same odds.
Rohan: That's every player with a dice jail.
Tia: The jail is harmless. Blaming the friend who lent you the die isn't.
Rohan: So roll it 200 times, do the chi-square, and if it passes, the die walks. Stats first, no favourites.
References
- Diaconis, P., Holmes, S., & Montgomery, R. (2007). Dynamical bias in the coin toss. SIAM Review, 49(2), 211–235. https://doi.org/10.1137/S0036144504446436
- Bartoš, F., Sarafoglou, A., Godmann, H. R., Sahrani, A., Klein Leunk, D., et al. (2025). Fair coins tend to land on the same side they started: Evidence from 350,757 flips. Journal of the American Statistical Association, 120(552), 2118–2127. https://doi.org/10.1080/01621459.2025.2516210 (preprint: https://arxiv.org/abs/2310.04153)
- Wizards of the Coast. System Reference Document 5.2.1. 2025. CC-BY-4.0. Sections: "Playing the Game" (Ability Checks; D20 Tests, Rolling 20 or 1; Combat, Death Saving Throws). https://media.dndbeyond.com/compendium-images/srd/5.2/SRD_CC_v5.2.1.pdf
- Tversky, A., & Kahneman, D. (1974). Judgment under uncertainty: Heuristics and biases. Science, 185(4157), 1124–1131. https://doi.org/10.1126/science.185.4157.1124
- Gilovich, T., Vallone, R., & Tversky, A. (1985). The hot hand in basketball: On the misperception of random sequences. Cognitive Psychology, 17(3), 295–314. https://doi.org/10.1016/0010-0285(85)90010-6
- Miller, J. B., & Sanjurjo, A. (2018). Surprised by the hot hand fallacy? A truth in the law of small numbers. Econometrica, 86(6), 2019–2047. https://doi.org/10.3982/ECTA14943
- Langer, E. J. (1975). The illusion of control. Journal of Personality and Social Psychology, 32(2), 311–328. https://doi.org/10.1037/0022-3514.32.2.311
- Henslin, J. M. (1967). Craps and magic. American Journal of Sociology, 73(3), 316–330. https://doi.org/10.1086/224479
- Diaconis, P., & Mosteller, F. (1989). Methods for studying coincidences. Journal of the American Statistical Association, 84(408), 853–861. https://doi.org/10.1080/01621459.1989.10478847
- Pearson, K. (1900). On the criterion that a given system of deviations from the probable in the case of a correlated system of variables is such that it can be reasonably supposed to have arisen from random sampling. The London, Edinburgh, and Dublin Philosophical Magazine and Journal of Science, 50(302), 157–175. https://doi.org/10.1080/14786440009463897